Database Monitoring Policy
Amazon RDS is one of the most popular cloud-based
relational databases today. Because of its ease of use, cost effects and
management simplicity are widely used by AWS customers. Although RDS as a
managed service does not require DBA to do much of the day-to-day work, it also
needs to monitor its stability and performance.
Because AWS doesn't automatically tune databases --
that's the responsibility of the user. Therefore, we need such a monitoring
strategy that requires the continued attention of the DBA and operations teams
for RDS.
In this article, we outline best practices for monitoring
RDS.
Q1: Maybe a lot of people
want to ask why they want to monitor the database?
Develop a database monitoring plan that
can target potential threats before the database actually experiences problems,
and help reduce the time and cost of post-maintenance. Most AWS infrastructure
architecture teams monitor resources such as EC2, ELB, Auto Scaling Groups, logs,
etc. The database monitoring priority is relatively low. Because the RDS
service itself is hosted, it is easier for customers to ignore this when using
rdS services.So the DBA/architect should develop and implement a database
monitoring strategy.
The overall monitoring strategy for
databases is complex, with the following to be included in defining which
databases to monitor:
l Service level
agreement
l Classified
fault type (near collapse, severe, medium, available, etc.)
l Build RACI
(Responsible, Accountable, Consulted, Informed) indicators
l Define upgrade
path, etc.
Define upgrade path, etc.
Q2:What exactly does the
monitoring database monitor?
Database monitoring, or RDS, for
example, not only focuses on performance, but also includes the following main
categories and modules:
|
Monitoring categories |
Monitoring Case |
|
Availability |
Can the client connect to an RDS instance or cluster? Whether the database has been down: such as instance
shutdown, restart, failover, etc. Do you support multi-AZ failover? |
|
Resilience |
Whether the RDS instance exists is backed up. Did the RDS instance backup fail? |
|
Health checks and performance |
Cpu, memory, disk space How much is the query delay? What is the read and write delay of the disk How long is the disk queue? How many active database connections are currently
available Is there a blocking or a transaction waiting now Is there an Error or Warning record in the database
log? Is it about app queries? Is it related to inappropriate parameter configuration? Is there a timed task that fails? |
|
Database instance management
operations |
Are there any changes to the DB instance? Tags, security groups, instance settings, parameter
groups, and option groups are the who made these changes? |
|
Security |
Who is connected to the DB instance? What query requests are they
executing? |
|
Fee |
How much does an RDS instance cost per month? |
Many of these types of metrics AWS can
directly monitor the cloud management platform of Silver Lining: CloudEasy can
effectively help users understand and analyze the rdS instance status. In this
article we will discuss what is available for monitoring RDS AWS? Next we'll
point out where cloudEasy can make monitoring easier.
1)Linked
to Amazon CloudWatch monitoring RDS built-in metrics
CloudEasy, the Silver LIning cloud
tube platform, combines the monitoring metrics collected by CloudWatch. Using
the REST API interface call, CloudEasy can crawl to the monitoring information
in CloudWatch: The following image is the metric that CloudEasy can see:

2)Built-in metrics
The RDS instance has built-in metrics.
These metrics can be collected from the host manager
running the RDS virtual machine, and some of the important content is generic.
It is recommended to monitor the following RDS metrics
with CloudWatch:
|
Index |
Why you need to monitor |
|
CPU usage |
A persistently high value means
that one or more processes are blocked. |
|
Disk queue depth |
Disk contention due to locking, long-running update
queries, etc. |
|
Database connection |
Problems that can occur when the application
generates multiple connections for each request |
|
Amount of free memory |
When the amount of free memory is low, it may
mean that there is not enough memory. |
|
Free storage space |
Low amount of free storage means that disk
space will run out of space |
|
Read IOPS |
Reading iOPS surges may mean that the number of
queries is too large. |
|
Write IOPS |
Writing IOPS bursts may mean that a large
amount of data has occurred with the update |
|
Read delay |
High read latency may mean disk operations,
which may be caused by locking |
|
Write delay |
High write latency may mean more disk
contention |
|
Replication delay |
High latency, large deviation between read-copy
operation and real-time data |
Amazon RDS Aurora engine also exposes
additional monitoring metrics that are useful for troubleshooting. At the time
of writing, Aurora only supports MySQL and PostgreSQL at home and abroad. We
recommend monitoring this data.
|
Index |
Why you need to monitor |
|
DDL operation delay |
A higher value means that the database has performance issues when
running the DDL command.This may be due to an exclusive lock on the object. |
|
Query delay |
Higher values can mean disk contention, poor write of query statements,
lack of indexes, etc |
|
Insertion delay |
Higher values may mean that locking or inserting statements are not well
written |
|
Remove delay |
Higher values may mean locked or poorly written DELETE statements |
|
Update delay |
Higher values may mean that locking or updating statements are not well
written |
|
Deadlock |
More than 0 may be problematic, query may be blocked |
|
Cache hit rate |
It should be a value close to 100, which means that the query does not
need to access the disk to get the data This should be a stable average. |
|
Number of queries |
Any sudden increase or sudden decrease should check the cause |
You can use AWS documentation to
get a complete list of built-in RDS metrics.
3)Performance
Insights
Performance Insights is a query monitoring tool for RDS
that is currently available for Aurora For Postgresql and may also be available
for Aurora For Mysql in the future. The performance view collects data from the
RDS query to identify the slow query.
Enabling RDS performance view has the following benefits:
Provides a real-time, hourly performance summary of
instances Draw its average active session (AAS) by time to show the load of the
instance.
This load is further divided into four sections:
l SQL queries;
l hosts;
l users;
l waits
Any of these load spikes can indicate that the database
has reached a bottleneck.
4)Automatic
monitoring of alerts and dashboard displays
We've learned which RDS metrics should be monitored. So
how will it be monitored? In fact, monitoring the metrics listed above in the
RDS instance above is time-consuming, and using alerts and dashboards will
improve monitoring efficiency:
The dashboard should include the following:
i) Alarms for high-priority events: for example, events
related to system stability should be handled immediately.
ii) Alarms defined by threshold: These alarms may not be
urgent, but require monitoring
Dashboards analyze long-term trends, troubleshoot, and
analyze historical issues.
High-priority events are as follows:
|
Alert content |
The way to realize |
|
|
|
Cannot connect instances or
cluster endpoints |
This can be done by running a Lambda function that checks the
availability of an RDS instance or cluster.When an instance or cluster does
not respond, the function can write a CloudWatch log event that can be
monitored. |
||
|
One or more databases in an
instance are not accessible |
This can be achieved by monitoring RDS logs and logging events in
CloudWatch logs |
||
|
An instance has stopped |
Monitorable via RDS event subscription |
||
|
Master failed over to replica |
Monitorable via RDS event subscription |
||
High-priority events are as
follows:
|
Alert content |
Priority |
|
CPU usage over 90% lasts
more than 10 minutes |
High |
|
File system usage or disk usage
exceeds 80% |
High |
|
Disk queue depth greater than 2
and lasts more than 10 minutes or disk IO average queue length is greater
than 2 for 10 minutes |
High |
|
Read delay greater than 10
milliseconds for 10 minutes |
High |
|
Write delay greater than 10
milliseconds for 10 minutes |
High |
|
Cache hit rate below 100% lasts
more than 10 minutes |
High |
|
Memory remains less than 2M and
lasts more than 10 minutes Physical memory available less
than 2M and lasts more than 10 minutes |
High |
We recommend creating two types of
dashboards:
One is the widget created by the high
priority metrics listed above.This is the first thing the DBA will check in the
dashboard this morning.
Second, general health indicators: read IOPS, write IOPS;
delay (SELECT, INSERT, UPDATE, DELETE), database connection, etc. Of course,
you can create alerts and dashboards in AWS Cloudwatch.
If you're streaming CloudWatch logs
to CloudEasy, you can build dashboards and alerts there.
5)监控RDS日志
AWS RDS instances can generate their
own log files.
Database log files can help users
locate faults and troubleshoot performance issues. Different database engines
have different types of log files: MS SQL Server has Error Log and Agent Log;
MySQL / MariaDB has General Log, Error Log, Slow Query Log; PostgreSQL has Que
ry and Error Log; Oracle has Analert
Log. Where costs permit, it is recommended that each customer collect logs from
the RDS instance and analyze the logs.
To deal with some important events,
such as: inaccessible or offline database, blocked queries, slow queries,
daemon failure, deadlock, login failure, replication delay is more serious,
instance failure switching, instance shutdown, database maintenance, database
version updates, etc.
RDS log files can be accessed in a
number of ways: AWS console, AWS command line, REST API calls, certain
databases, such as Aurora for PostgreSQL, which are also available in The
CloudWatch log, From the console you can choose to view the logs, and you can
also talk about the logs downloaded down for analysis.
Meanwhile, MySQL, MariaDB or MySQL
Aurora can send logs to CloudWatch. Where costs permit, it is more recommended
that customers monitor RDS logs using automated operations.
The configuration is also simple,
collecting relevant logs into the cloudwatch log.
We can also download log files for
analysis, including on the command line, SDK, etc., to save money.
6)RDS Events
MonotorRDS Events
With Amazon RDS, you also need to track events related to
db instances:
THERE ARE DIFFERENT CATEGORIES OF RDS EVENTS:
|
Event source |
Event types involved |
|
Instance |
Events
related to database instances |
|
Security
group |
Security
group events on database instances |
|
Parameter
group |
RDS
parameter group related events |
|
Snapshot |
Events
related to instance snapshots |
|
DB cluster |
Multi-instance
cluster-related events |
|
DB
instance cluster snapshot |
Multi-instance cluster snapshot-related
events |
Events may include the following:
l Events may include the following:
l Events related to the availability of RDS instances;
l Events related to failures in RDS instances;
l Events related to disk space issues in RDS instances;
l Events related to failover, start-ups and the closure of
RDS instances;
l Events related to backups and snapshots of RDS instances;
Events related to any configuration changes in the RDS
instance. Dbas or AWS administrators can create subscriptions for the events
they want to monitor.When an event occurs, the subscription sends a
notification to the receiver.
7)CloudTrail
When an account enables AWS CloudTrail, it records calls
to each API for any AWS resource in that account. CloudTrail logs can be stored
in S3 buckets and can be used for security and compliance audits. We recommend
CloudTrail as part of RDS monitoring.
In addition, the CloudTrail log event display includes:
event name, event date and time, IP address for generating the event, AWS user
name for generating the event, and connection key ID. CloudTrail logs are JSON
documents with different fields. These documents can be used and parsed through
tools such as CloudEasy.
We recommend monitoring CloudTrail for the following RDS
API calls:
|
RDS API CASE |
Why should monitor |
|
DeleteDBInstance |
Audit delete DB instance behavior |
|
DeleteDBCluster |
Audit to remove DB cluster behavior |
|
ModifyDBInstance |
Audit modifying database behavior |
|
ModifyDBCluster |
Auditing database cluster behavior |
|
FailoverDBCluster |
Record cluster forced failover behavior |
|
ModifyDBParameterGroup |
Audit parameter group modification to conduct |
|
RebootDBInstance |
Audit reboot DB instance behavior |
|
PromoteReadReplica |
Audit database read copy promotion to database master instance behavior |
|
StopDBInstance |
Audit Stop Database Instance Behavior |
At the same time, our platform, CloudEasy, can access
instance-level operations at the database level through CloudTrail and track
the use of resources in conjunction with AWS Config.
8)Monitor
with Amazon Trusted Advisor
Finally, it's worth noting that AWS
provides the Amazon Trusted Advisor service, which evaluates whether resources
under the account are in line with AWS best practices. Although AWS Trusted
Advisor is not a strict performance monitoring tool, it can be a great help.
Combined with AWS Trusted Advisor, CloudEasy has made appropriate security
checks on idle database instances, unlimited access to database security
groups, database instances without snapshot, etc., and is displayed in the
dashboard, which customers can use. Make changes to the configuration of the
related service.
Silver Lining AWS Experience
in Cloud Database Architecture and Operational Maintenance
Silver Lining AWS Database
Architecture and Operations Experience on the Cloud Silver Lining itself is a
user of all in AWS, and since its inception, we have used a range of AWS
database services, including RDS and Redshift, on our self-developed cloud
management platform, CloudEasy. Provide real-time monitoring, alerting, log
analysis, billing management, RI purchase advice, and more for our customer
base, while evolving to aurora databases at the pace of AWS!
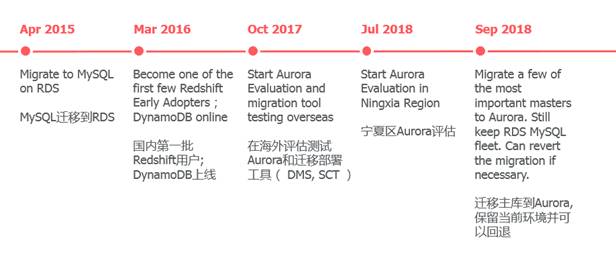
Silver Lining is the first domestic
production environment database to migrate to Aurora customers, in addition to
strong technical strength, but also accumulated a wealth of migration and
implementation experience! If you have relevant database requirements, such as
database on the cloud, homogeneous / heterogeneous database migration, highly
available data on the cloud, data tolerance, big data analysis, etc. , please
contact 021-63251066, Silver Lining will provide you with the best service.
For more
information, please visit https://www.sh-silverlining.com